Strong Housing Demand, Real Headwinds

Somewhere in the data released this spring, there is a single number that explains the remodeling market better than almost any other: 11.2%.
That is the share of American households that relocated in 2024, according to the American Community Survey. It is the lowest residential mobility rate on record. Fewer people moved last year, as a share of the population, than at any point since the government began tracking this figure. Homeowners were especially rooted in place: their mobility rate dropped from 5.5 to 5.1% between 2023 and 2024.
Why? Because moving is expensive when home prices are high, and mortgage rates are high, and your current mortgage carries a rate that no lender will touch today. The median homeowner who refinanced or bought before 2022 has a rate in the low-to-mid-threes. Trading that for a 7% loan on a more expensive house, to get a house they may not like better, is a trade most people are refusing to make. So, they stay. They do the kitchen remodel that they would have put off if they were planning to move. They finish the basement. They finally address the aging roof and the HVAC system they have been nursing for years.
This is the structural engine of the 2026 remodeling market. It is real, and it is not going away. But understanding what is happening at midyear requires holding a more complicated picture: the tailwinds are genuine, and so are the headwinds. The firms that will finish the year well are the ones that can see both clearly.
The housing market that refuses to move
The Harvard JCHS State of the Nation's Housing 2026, released this spring, is the most comprehensive annual assessment of where things stand. Its picture of the broader housing market is one of sustained constraint, in ways remodelers should read as both an opportunity and a warning.
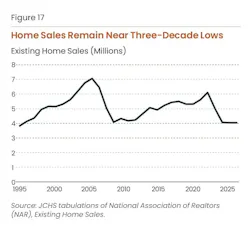
Existing home sales are at their lowest levels in three decades. Household growth, a key driver of new housing demand, slowed to 1.1 million in 2025, down sharply from an annual average of 2.0 million in 2020 and 2021, and consistent now with the more modest levels of the 2010s. The reasons are layered. The job market added just 116,000 positions in 2025, the smallest gain in a non-recession year since 2002, according to the Bureau of Labor Statistics. Consumer confidence, already low, has declined further into 2026 amid escalating conflict in Iran. Student loan delinquency jumped from under 1% in late 2024 to 10% by the end of 2025 as the pandemic-era pause on federal loan payments expired.

Net international migration, another major driver of household formation, halved in 2025. The Census Bureau projects it will fall another 75% in 2026 to just 321,000 people, roughly a third of the 900,000 annual average from 2001 to 2019. The implications for housing demand are profound and will compound over time: fewer immigrants means fewer new households, means less pressure on the housing stock, means less urgency to build or buy or, eventually, renovate.
The Harvard report notes one specific consequence for states that have relied heavily on domestic migration for growth: Texas and Florida are seeing those inflows slow as the internal migration patterns that drove Sun Belt growth over the past decade moderate. The Midwest, interestingly, recorded net domestic in-migration in 2025 for the first time in at least 20 years.
Single-family housing starts fell 7% in 2025. New home sales slipped 1%. Builders responded by cutting prices, buying down buyers' interest rates, and pivoting toward smaller homes and townhomes. A growing share turned to the build-to-rent market: single-family homes built specifically for rental occupancy now represent 11% of completions, nearly three times the historical average. That is a signal about the shape of demand, and it is worth noting: households that might have bought are renting instead, and some of those rentals are single-family homes that will eventually need capital improvements.
For remodelers, the housing market's paralysis is a double-edged condition. It channels spending toward improving the existing stock rather than relocating. It also suppresses the move-in project pipeline that has historically been a reliable source of high-ticket work. Both things are true at once, and the balance between them will shape the second half of the year.
The remodeling demand signal
Against this backdrop, the demand for remodeling services remains positive, though the trajectory is moderating. Harvard's Leading Indicator of Remodeling Activity (LIRA) projects annual homeowner spending on improvements will reach $518 billion by the end of 2026, with year-over-year growth running at 2.1% at midyear before easing to 1.6% by year-end. That is a deceleration from recent years, but it is not a contraction. Single-family home sales and permitting have picked up modestly from very depressed levels, which Harvard notes should support a nominal increase in remodeling activity as those transactions close and buyers begin their renovations.
The NAHB/Westlake Royal Remodeling Market Index (RMI) confirms the cautiously positive picture. At 62 in the first quarter of 2026, the index sits two points below Q4 2025 but comfortably above the 50 threshold that separates growth from contraction. The index has been positive for years running. The current conditions component, at 70, reflects that remodelers are still busy. The future indicators component, at 54, reflects that the forward-looking signals are softer.
The breakdown within the RMI is instructive. Small remodeling projects, those under roughly $25,000, were the only segment to post a quarterly gain, edging up to 74. Moderate projects fell two points to 69. Large projects, the whole-home renovations and substantial additions that represent the high-revenue work many firms prize, fell two points to 67. The backlog component dropped three points to 58.
NAHB notes that remodelers remain broadly positive, but they are working harder to meet client expectations than they were a year ago. Only a small share reports putting projects on hold due to economic uncertainty. But the trajectory of sentiment, among both remodelers and consumers, points toward a tighter market in the back half of the year.
The aging-in-place megatrend
One segment of the remodeling market operates on a fundamentally different clock: aging-in-place modifications for older adults.
The Harvard JCHS projects that the number of householders 65 and over will grow 26% between 2025 and 2045, reaching 49.7 million. The growth at the oldest end of the age distribution is even more dramatic: householders 80 and over will double from 9.6 million in 2025 to 19.2 million by 2045. This is not a projection sensitive to economic cycles or interest rates. It is a demographic certainty.
The Harvard report notes specifically that this shift is increasing demand for accessible housing features, "either for housing with relevant features or for remodeling services to improve the accessibility of existing units." More than half of professional remodelers were involved in home modifications to support aging in place in 2024, according to NAHB data. These are not luxury projects but functional necessities for a rapidly growing population that, in most cases, has both the assets and the intent to stay in their homes.
There is also a secondary effect worth tracking. The baby boom generation, now between roughly 62 and 80 years old, is an enormous cohort transitioning through this aging process together. Harvard data show that the number of households headed by baby boomers dropped by 425,000 between 2023 and 2024, as householders died or moved to managed care facilities. That consolidation will accelerate. The homes those households occupied enter the market for sale, for rental, or for renovation by the families who inherit them. This demographic wave is both creating aging-in-place projects for boomers and releasing inventory for the next wave of buyers who will want to update their purchases.
Firms that have invested in Certified Aging-in-Place Specialist (CAPS) training and have built referral networks with healthcare providers, occupational therapists, and elder law attorneys are accessing a stream of project leads that will grow regardless of what happens with tariffs or consumer sentiment. In a year when larger discretionary projects face headwinds, the structural nature of this demand warrants serious attention as a business development priority.

The tariff tax on your materials
If there is one input that is reshaping bids and testing client relationships across the remodeling industry in 2026, it is tariffs on building materials.
NAHB estimates that current tariff actions have added approximately $10,900 to the cost of a new home. The aggregate impact on residential construction investment is projected at roughly $30 billion. These figures capture the industry-wide effect, but for individual remodelers, the impact is more direct and harder to hedge.
Steel and aluminum face a 50% Section 232 tariff. Canada supplies approximately 85% of the softwood lumber imported into the United States, and that lumber is subject to a 10% tariff. Appliances, many manufactured in Mexico or containing Chinese-made components, have risen 16 to 18% on common items, including dishwashers, ovens, and ranges, the exact products that appear in kitchen renovation scopes nationwide.
Construction Dive reported that tariffs drove construction input prices up sharply in January 2026, and the trend has continued. NAHB data show that more than 60% of builders surveyed have reported higher costs due to tariffs. Aggregate construction costs are estimated to have risen by roughly 8% under current tariff policy, with specific material categories increasing by up to 25%.
For remodelers, this is also a client relations challenge. The kitchen that a client priced in January and planned to start in July now costs significantly more. The gap between their expectations and the actual scope will lead to difficult conversations. The NAHB RMI data flag this explicitly: many remodelers report that managing customer cost expectations is their dominant challenge in 2026. "Fortunately," everyone is feeling the pinch together, so clients are likely to understand/expect the conversation. In some cases, clients are pausing projects. In most cases, they are renegotiating scope or phasing work over longer timelines.
The practical response is well-known but worth stating plainly: lock in material prices for committed projects as early as possible. Build escalation clauses into contracts on projects with long lead times. Source domestically where it makes economic sense. Have the tariff conversation with clients directly, before they encounter the number in a revised bid, so it lands as information rather than a surprise.
The labor market is getting more complex
The construction labor shortage has been a persistent drag on capacity for years. In 2026, it has taken on a more complicated character. The Associated Builders and Contractors estimates the industry must attract approximately 349,000 net new workers this year just to hold ground against current demand. The trade press has covered the baseline labor shortage extensively; what is different in 2026 is the convergence of three simultaneous pressures that make the shortfall harder to address.
The workforce is aging. Construction has always skewed toward older workers, and retirements are accelerating as the baby boom generation ages out of the trades. The incoming cohort of workers to replace them is smaller and, in some trades, less experienced.
Immigration has tightened significantly. A substantial share of the residential construction workforce has historically been immigrant people, a significant share of whom are undocumented. Increased ICE activity in 2025 and 2026 has reduced the available pool of workers in many markets, lengthened timelines, and in some cases halted projects when subcontractors have been unable to field crews.
Competition from non-residential construction has intensified. The data center construction surge, driven by AI infrastructure investment, is pulling skilled electricians, ironworkers, and HVAC technicians toward unionized commercial projects that often pay higher wages and offer more consistent schedules than residential remodeling. In markets where this competition is acute, residential contractors are finding it harder to hold their best subs.
The Home Builders Institute quantifies the cost to the broader residential sector: $10.8 billion annually, broken into $2.7 billion in higher carrying costs and $8.1 billion in value lost to unbuilt homes (an estimated 19,000 per year). For remodelers, the translation is longer timelines, higher subcontractor costs, and reduced capacity to take on new work even when client demand is present.
There is a structural irony in this that the broader housing data make explicit. Moody's identifies workforce housing, the modest- and middle-income segment that falls between low-income subsidy programs and what the high-end market naturally produces, as the most acutely underserved part of the housing supply. That is precisely the income range occupied by much of the residential construction workforce.
The carpenter, the plumber, the framer, and the drywall finisher working in a high-cost metro are increasingly unable to afford to own a home there.
The State of the Nation's Housing Report documents cost burdens at record highs for renters and worsening for homeowners; data that describes the financial reality of many of the tradespeople the industry depends on. The people who build and renovate houses are being priced out of them. The labor and housing shortages become, in this sense, not separate phenomena but the same problem.

Consumer psychology: The unknown variable
The University of Michigan Consumer Sentiment Index sits at 49.5 as of June 2026, up modestly from a preliminary reading, aided by falling gas prices, but still the second-lowest in a dataset stretching back to the 1970s. The index is 19% below where it was a year ago and has plummeted 13% since January 2026. The subindexes tell a more nuanced story. The Index of Consumer Expectations rose 15% in June alone, from 44.1 to 50.7, suggesting that consumers saw some near-term relief. The Current Economic Conditions Index also improved, from 45.8 to 47.7. Consumers, however, expect inflation to persist; they are slightly less pessimistic than in May, but not optimistic.
The Harvard report notes that homebuying costs have created an additional layer of constraint on decision-making: homeowners with below-market mortgage rates face an "added disincentive to relocate," meaning they feel simultaneously motivated to stay and improve their homes but anxious about the economic environment that would normally support that spending. The result is a client base that is ambivalent about large commitments.

What the housing shortage means, structurally
Underneath all the cyclical noise of 2026 is a structural reality that ensures sustained long-term demand for renovation and repair, regardless of what happens with tariffs, consumer confidence, or interest rates in any given quarter. Moody's Analytics, in a paper released last July by Chief Economist Mark Zandi and co-authors from the Reinvestment Fund, PolicyMap, and the Urban Institute, puts the national housing deficit at approximately 2 million homes. This figure, they argue, understates the problem because it is based on vacancy rates that do not fully capture pent-up households: the estimated 1.2 million households that would exist today if housing were sufficiently available and affordable.
Other estimates of the shortfall range widely. NAHB puts it at 1.5 million. Freddie Mac estimates 3.7 million. Zillow calculates 4.5 million. The National Association of Realtors cites 5.5 million, based on the cumulative underbuilding since 2000. The National Low Income Housing Coalition estimates a shortfall of 7.1 million units for extremely low-income renters alone. The variation reflects differing methodologies and definitions, but no credible analyst argues that the country has enough housing. Harvard reports that homeowner vacancy rates remain at 1.1%, compared to a historical average of 1.6%, while renter vacancy rates at 7.3% remain below historical norms.
The Moody's analysis makes a point that the national numbers hide enormous local variation. Their census-tract-level analysis, covering 40 million housing units across cities with populations over 100,000, found that over three-quarters of the nation's metropolitan areas have a housing shortage. The most acute shortages are concentrated in the Southeast, the industrial Midwest, and parts of the Southwest. The shortage is most severe in rental housing and in what Moody's calls "workforce housing," the modest- and middle-income communities between low-income subsidy programs and the high-end market.
Existing housing stock is under more pressure than at almost any point in modern history. Homes that might have been replaced are instead being maintained, renovated, and updated for occupancy they would not otherwise have needed to support. The age of the housing stock increases alongside the renovation needs embedded in it.

Cost burdens have hit another record high for renters and have worsened for homeowners, creating political pressure for housing policy action while also reflecting the underlying reality that people are stuck in houses they may not be able to afford to leave and certainly cannot afford to replace.
The Harvard report also documents who is under pressure. Among the 11 million households with extremely low incomes competing for 3.8 million affordable and available rental units, the gap is catastrophic. For the broader middle-income market, the gap is more subtle but no less real: people spending more than they can comfortably afford on housing, with less disposable income for the improvements that would make those homes more livable.
Regional signals
The Moody's analysis identified specific regions where housing pressure is most acute, and those regions overlap substantially with regions where remodeling demand should be strongest.
The Southeast, the industrial Midwest (Cincinnati, Cleveland, Detroit, Pittsburgh), and parts of the Southwest face the most acute housing shortages as a share of their housing stock. These are markets where new construction is not keeping pace with demand, existing housing stock is working harder, and the pressure to improve what exists rather than replace it is structural.
The Sun Belt markets, Texas and Florida in particular, have seen a moderation in the domestic migration that drove their recent growth, but they continue to absorb significant population growth. Their housing markets have more new construction in the pipeline than the Midwest and parts of the South, but they are also contending with insurance cost spikes, particularly in Florida, that are reshaping the calculus of homeownership and renovation investment in ways worth watching.
California's situation is distinctive. Moody's notes that vacancy-rate-based shortage estimates understate the California problem because they miss both pent-up households who cannot afford to form and the population experiencing homelessness (more than 187,000 people, per the 2024 point-in-time count). The January 2025 wildfires destroyed additional inventory that the 2023 Moody's data do not yet capture. The reconstruction market in wildfire-affected areas of Los Angeles represents a specific and substantial demand center for the next several years.
What to watch in the second half
The data point to five specific variables that will determine whether the back half of 2026 is stronger or weaker than the first half.
Consumer sentiment trajectory. The June uptick in the University of Michigan index was driven by falling gas prices. Whether it holds and extends depends on what happens with inflation, the Iran conflict, and the broader trade environment. A sustained move above 55 on the Michigan index would be a meaningful signal that discretionary project demand is stabilizing. A decline back toward the April lows would indicate the opposite.
Tariff policy. The current tariff environment is a negotiating environment. Lumber, steel, and aluminum tariffs are substantial and largely in place, but trade policy has shifted rapidly throughout 2025 and 2026. Any reduction in tariffs on Canadian lumber or steel would flow quickly into material costs. Remodelers should watch NAHB's tariff tracker and factor volatility into how they structure material purchases for long projects.
Labor availability. Immigration policy is likely to remain a factor throughout the year. Firms should diversify their subcontractor networks, invest in employee training, and build relationships with workforce development programs (community colleges, trade schools, apprenticeship programs.
Home sales volume. Any uptick in existing home sales, even modest, would accelerate the move-in renovation pipeline. Harvard's report notes that even a slight pickup in single-family permitting and sales supports LIRA's modest growth projections.
Aging-in-place demand. This one is not a certainty. The only question is how many firms have positioned themselves to capture it systematically.
The bottom line for American housing
The 2026 remodeling market is best understood as one characterized by structural demand, cyclical friction, and operational complexity. The housing shortage ensures that the existing stock is under sustained pressure. The mortgage lock-in effect channels spending toward renovation rather than relocation. The demographic wave of aging householders guarantees growing demand for accessibility modifications. The $518 billion in projected annual homeowner improvement spending is not a fiction.

But the friction is just as real: tariffs have raised material costs 8 to 25% depending on the category. The construction labor market is under three simultaneous pressures. Consumers are operating at near-historic levels of pessimism. Large projects face more sales resistance than small ones. Backlogs, while still positive, are narrowing.
The NAHB RMI, at 62, indicates the remodeling market is growing. It does not say it is growing easily. Both of those things are true, and the firms that navigate 2026 well will be the ones that hold both in mind at once: disciplined on costs, active on client communication, invested in labor, and clear-eyed about which segments of demand are structural versus which are sensitive to the next shift in consumer confidence.
Data sources:
- Harvard JCHS State of the Nation's Housing 2026
- Moody's Analytics/Reinvestment Fund/PolicyMap, "Bringing the Housing Shortage Into Sharper Focus," July 2025
- NAHB/Westlake Royal Remodeling Market Index, Q1 2026
- Harvard JCHS Leading Indicator of Remodeling Activity, Q2 2026
- University of Michigan Surveys of Consumers, June 2026
- Associated Builders and Contractors
- Home Builders Institute, Construction Labor Market Report, Fall 2025
- Bureau of Labor Statistics
- National Association of Realtors
- Freddie Mac
- National Low Income Housing Coalition
About the Author
 Daniel Morrison
Daniel Morrison
Editorial Director
Daniel Morrison is the editorial director of ProTradeCraft, Professional Remodeler, and Construction Pro Academy.